The short version
New Mauritius Hotels trades at Rs 13.95. On this evidence I would not buy it at that price.
It is priced above every one of its listed peers on enterprise multiples, and it carries the heaviest debt load of the nine companies I looked at. You are paying a premium for the balance sheet least able to absorb a bad season.
The interesting part was not the answer. It was that the spreadsheet produced two wrong numbers first, and neither was an arithmetic mistake.
Everything below comes from these filings. They are public — open them alongside and check me.
The question was simple. New Mauritius Hotels — Beachcomber, the largest hotel group in the country — trades at Rs 13.95 a share. Is that cheap?
There is only one honest way to answer it: find every company that does the same thing, work out what the market pays for each rupee they earn, and see whether the target sits above or below them. That is a trading comparables set. Nine companies, every figure taken from audited accounts and page-cited. It took about a week.
The answer, when it came, was less interesting than what I had to fix to get there. Two of the numbers the spreadsheet produced were wrong, and neither was an arithmetic mistake. A third pair of numbers was identical and meant completely different things.
This post is about that: how much of a published financial number is a choice rather than a fact, and how you find out before you put money behind it.
What I found on the way to that answer
- Two listed companies own the same hotels, and one came out Rs 1.7bn bigger. Hotelest holds 51% of Constance and does nothing else. One wrong input caused it; correct that input and the two land Rs 0.41m apart. See it
- Sun and Lux sit on the identical P/E of 5.90 and are not remotely alike. On enterprise value it is 6.08x against 3.77x. The P/E hides the debt; the enterprise multiple shows it. See it
- Rs 9.3bn of Bank of Mauritius Covid money sits inside shareholders’ equity, not debt. Sun prints gearing of 16.8% and 39.6% on the same page of the same report. Both are correct. See it
- Two of the nine companies never publish a depreciation line at all, so no EBITDA can be derived for them. The peer statistics here rest on four companies, and every one of them says so on its face. See it
- Beachcomber is priced above the 75th percentile of its listed peers. That is the arithmetic behind the answer above, built step by step. See it
Step oneChoosing who counts as a peer
Before a single number, you have to defend the list. The Stock Exchange of Mauritius files companies under a sector label, and that label is not reliable. I tested each candidate against its registered nature of business in the companies registry instead — the same source I use in Project Nightfall to trace who owns what in Mauritius.
Three got thrown out:
- Stevenhills — filed by the exchange under Leisure and Hotels. The registry describes it as a bookmaker taking fixed-odds bets on football played outside Mauritius. Not a hotel.
- Attitude Property — a landlord whose tenants happen to be hotels. Real estate.
- Beachcomber Hospitality Investments — preference shares only. There is no ordinary share price, so no multiple can exist.
The habit. A peer set is defended in words before it is defended in numbers. If you cannot write one sentence saying why a company belongs, it does not.
Step twoWhat you are actually paying for
Buy every share in a company and you do not own it outright. You inherit its debt, you inherit the outside shareholders sitting inside its subsidiaries, and you get to keep the cash already in the till. Enterprise value is the price of the whole business once all of that is settled.
Note the fourth bar. Almost Rs 2bn of Sun’s enterprise value is a convertible bond that its own balance sheet files under equity, not debt. Hold that thought — it becomes the biggest finding in the whole exercise.
The rule that stops you fooling yourself
Once you have two different measures of size, you can pair them with the wrong profit figure and produce a number that means nothing.
Cross them — divide enterprise value by net income — and you charge the shareholders for the lenders’ money as well. The more indebted company then looks dearer for no operating reason at all.
Step threeThe same number can mean two different companies
This is the part nobody warns you about. A multiple is a ratio, and a ratio throws away everything except its two inputs. Two companies can land on exactly the same number and be nothing alike.
Sun and Lux are the cleanest example in the set. Both are Mauritian resort operators. Both report to June 2025. Both were priced on the same day. And both trade on a price-earnings ratio of 5.90x — identical to two decimal places.
On EV/EBITDA one costs 6.08x and the other 3.77x. A 61% difference in what the enterprise costs per rupee of operating cash — between two companies a shareholder is paying the same earnings multiple for.
The reason is not performance. It is who funded the business.
Read across those bars and the peer set stops looking like one sector:
- Sun and Lux are equity-funded businesses. Debt is 18% and 27% of funding; net debt is under three-quarters of one year’s EBITDA. When you buy the equity you are buying most of the enterprise.
- Constance is a debt-funded business. 68% of its funding is borrowed. Its equity is a thin slice on top of Rs 5.4bn of borrowings — which is exactly why it trades at 0.31x book while Sun trades at 2.02x.
- Beau Vallon and NMH sit in between, at 53% and 57% debt.
What this does to a multiple. A cheap-looking EV/EBITDA on a heavily geared company is not the same bargain as the identical number on an ungeared one. In the first case most of the enterprise you are buying already belongs to a bank. The equity is a smaller, riskier slice of the same hotels.
Which is why leverage is the number I would check first
Sun could repay every rupee it owes, net of cash, out of roughly eight months of EBITDA. New Mauritius Hotels would need three years. Same industry, same island, same guests — entirely different exposure to a bad season.
Hold this against the valuation. The target is the most levered company in its own peer set. Any premium it trades at has to be justified despite that, not in ignorance of it.
The first lieRs 1.7 billion that was not there
Two of the nine are the same business. Hotelest Limited exists to hold 51% of Constance Hotels Services. Its accounts say so in one line:
The only activity of Hotelest Limited is to hold 51% of the share capital of Constance Hotels Services Limited.
Hotelest Limited, abridged audited financial statements, year ended 31 December 2024, note 1Because Hotelest controls Constance, IFRS 10 makes it report Constance whole — every rupee of revenue, every hotel, every liability, at 100% rather than 51%. So both companies’ accounts describe the same hotels, to the rupee.
How consolidation actually works — open if this is new
The trigger is control, not the size of the stake. More than half the votes usually gives it, which is why 51% is the number people quote — but a stake can clear 50% without control, and control can exist below it. Below control you get the one-line treatment instead: Constance’s own filing consolidates its subsidiaries in full while its overseas associates appear as a single line, Share of results of associates 206,087.
The 49% Hotelest does not own comes back once, at the very bottom, and it ties exactly:
Same hotels. Same debt. So the two enterprise values should match. They did not.
The whole gap is one line: the minority interest, the 49% of Constance that Hotelest does not own. Both companies add it to enterprise value. They just price it differently — and one of the two prices is sitting on a screen.
Constance trades at 0.31 times book, so carrying its minority at book triples it. Here is the whole thing reconciled — the overstatement, and what happens when you remove it:
Two numbers, 0.41 apart — do not confuse them. The bracket on the chart above measures 1,692.53: the gap you can actually see between Constance and Hotelest-at-book. The calculation here gives 1,692.94: the overstatement that caused it. The 0.41 between them is simply how close the two companies land once the input is fixed — and it is the reason to trust the result. When two routes to the same business agree to 0.01%, the method is sound and the earlier number was wrong.
Why a minority belongs in enterprise value at all
EV/EBITDA is a fraction, and consolidation has already decided the bottom of it: EBITDA holds every hotel. So the top has to buy every hotel too. Count only what the parent’s own shareholders own and you are pricing half the hotels against all of the profit.
The rule that falls out of it. A comp set holding both a listed parent and its listed subsidiary has to mark the minority to market — or drop one of the two rows.
The second lieRs 9.3 billion hiding inside equity
During Covid the Mauritius Investment Corporation — owned by the Bank of Mauritius — bought convertible bonds from almost every hotel group in the country. Five years on the money is still there, and almost all of it is classified as equity.
Between 13% and 17% of every enterprise value in the sector is this one instrument. Count it as a claim and the multiples are one set of numbers; ignore it and they are another, half a turn to a full turn lower.
And nobody is hiding it. Three companies tell you, three different ways, that this is a decision rather than a fact.
One: it says so outright
For the classification and measurement of the funds received from the Mauritius Investment Corporation Ltd, a policy choice is available… The Directors have opted to treat the convertible bonds as equity…
Constance Hotels Services Limited, Annual Report 2024, note 2(t)Two: it prints both answers
Sun’s narrative reports gearing of 16.8%. The table beside it, on the same page, reports 39.6%. Both are correct. They differ on one question: is a Bank of Mauritius convertible debt?
Three: it builds around it
New Mauritius Hotels is moving its Moroccan resort into a separate company and selling 51% of it — “to share risk, fund the extension project and repatriate capital to Mauritius” — then operating the hotel under a management agreement with Fairmont. Sell control and the resort’s debt leaves your balance sheet with it. On Zanzibar the report is blunter still: the acquisition will be funded “in line with our gearing target”. New Mauritius Hotels Limited, Annual Report 2025, chief executive’s interview, p.8.
The Morocco structure, drawn
In plain terms, NMH stops owning the hotel and starts running it for a fee. It takes cash out, keeps 49%, and the debt that built the resort leaves with the 51% it sold — because what you no longer control, you no longer consolidate, and what you do not consolidate never reaches your gearing ratio. The report gives the structure and the gearing target; the deconsolidation is the standard consequence of losing control.
None of this is deception. Every figure is disclosed, audited and correct. But three of the largest hotel groups in the country are telling you, in their own words, that the balance sheet is a set of decisions. Read the accounting policy note before you trust a ratio.
Step fourWhat the filings simply do not tell you
Mauritius has tiered disclosure. Companies on the Official Market publish full annual reports. Companies on the DEM can satisfy the rules with a single page. Two of my nine publish accounts with no depreciation line at all — which means EBITDA cannot be built from them.
The temptation is to estimate the missing depreciation from peers and manufacture an EBITDA. That would put an invented number into the denominator of the headline multiple. I left the cells blank and published the observation count under every statistic instead.
A blank cell is a finding. An invented one is a liability. Four observations covering 93% of the sector’s value is a defensible peer statistic, as long as you say “n = 4” out loud.
Step fiveWhat the reports do tell you, if you read them
Owning a hotel and running one are different businesses
Lux Island Resorts keeps 26.0% of what its guests spend. Sun keeps 31.8%. Nearly six points apart, which reads like Sun simply runs better hotels.
It is not that. The two companies are not doing the same job.
Sun owns its resorts and runs them. The people at the front desk are Sun’s own staff, and their wages sit inside Sun’s costs. Lux owns its hotels but does not run them. It pays another company to do that — and that company belongs to the same parent group.
The management of the different hotels is entrusted to its sister company, The Lux Collective Ltd, under a long term management contract.
Lux Island Resorts Ltd, Integrated Annual Report 2025, note 1So Lux pays Rs 504m for a job Sun does in-house. That fee is an expense, so it comes out of Lux’s profit before the margin is calculated. Sun has the same job to do, but pays its own staff, and those wages are already inside its costs too — the difference is only whose income statement the money passes through.
Put the fee back and the comparison becomes fair:
But does the fee not just cover the wages? No — and this is worth checking before you trust the add-back. Lux carries its own payroll: note 25 shows Rs 2,593m of employee benefit expenses, 24.6% of revenue, an ordinary hotel wage bill. The Rs 504m management fee sits on top of that. Lux employs the people; it pays its sister for the brand and the running of the place. So if Lux operated its own hotels it would keep the fee and still pay the same wages — which is exactly what the add-back assumes.
The six-point gap is really one point. The other 4.8 points never measured hotel quality at all — they measured a decision about which company in the group signs the payroll. And because both companies sit under the same parent, that fee is set between related parties rather than by a market.
Every hotel in the country is halfway through a refurbishment
Riveo closed Four Seasons Anahita for seven months and booked Rs 128m of closure costs. Morning Light lost Rs 53m in 2024 “following a slow start post-renovation”, then made Rs 52m in 2025 on the same building. Sun, Lux, Constance and NMH are all mid-programme.
Consequence. A trailing-twelve-month EBITDA multiple for a hotel is partly a bet on where that hotel sits in its refurbishment cycle. Morning Light is the clean proof: same asset, same management, loss one year and profit the next, with the renovation as the only variable.
A Mauritian hotel comp set is partly a Maldives comp set
| Company | Outside Mauritius |
|---|---|
| Lux Island Resorts | Réunion and Maldives — 30.6% of EBITDA |
| Constance Hotels Services | Maldives 35.8% of revenue; Seychelles and Madagascar associates are 40% of pre-tax profit |
| New Mauritius Hotels | Morocco and Europe — 19.7% of revenue |
The verdictSo — is it worth buying?
Every number, in one table
This is the model itself — the four Tier 1 peers, then Beachcomber held out as the target. Rs million, prices at 31 December 2025.
First, what each business costs. Every row is the bridge from Step two run again, and every row adds across to the rupee, so you can check it rather than take my word for it.
Scrolls sideways on a phone.
| Company | Price Rs | Shares m | Market cap | + Debt | + Minority | + Other claims | − Cash | = Enterprise value |
|---|---|---|---|---|---|---|---|---|
| Sun | 43.10 | 174.364 | 7,515.09 | 2,510.20 | 1,561.81 | 1,991.74 | 1,016.11 | 12,562.73 |
| Lux Island Resorts | 52.00 | 137.116 | 7,130.03 | 3,244.27 | — | 1,460.28 | 1,505.34 | 10,329.24 |
| Constance | 14.25 | 109.653 | 1,562.56 | 5,369.32 | (38.13) | 961.72 | 375.01 | 7,480.45 |
| Beau Vallon | 4.00 | 175.645 | 702.58 | 1,175.96 | — | 348.25 | 123.20 | 2,103.59 |
| New Mauritius Hotels | 13.95 | 548.982 | 7,658.30 | 16,215.42 | 151.71 | 4,559.95 | 1,645.48 | 26,939.89 |
Constance’s minority is negative because its own subsidiaries carry accumulated losses. Lux and Beau Vallon have no minorities at all. Beachcomber’s Rs 16.2bn of debt is larger than the entire enterprise value of three of its four peers.
Then, what each business earns.
| Company | Revenue | EBITDA | EBIT | Net income | NAV |
|---|---|---|---|---|---|
| Sun | 6,502.24 | 2,067.07 | 1,730.08 | 1,273.84 | 3,722.47 |
| Lux Island Resorts | 10,555.61 | 2,741.79 | 1,929.63 | 1,208.28 | 8,380.26 |
| Constance | 6,149.09 | 1,794.26 | 1,083.32 | 314.38 | 5,095.34 |
| Beau Vallon | 1,147.41 | 440.27 | 327.70 | 221.35 | 1,519.94 |
| New Mauritius Hotels | 16,890.38 | 4,781.56 | 3,756.57 | 1,737.57 | 11,958.07 |
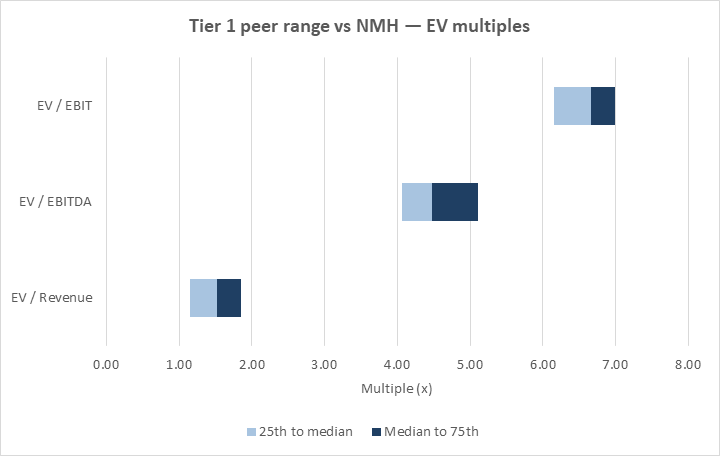
Divide the first table by the second and you get the comp set. The three shaded rows are the peer group summarised across those four companies; Beachcomber sits underneath for comparison.
| Company | EV/Rev | EV/EBITDA | EV/EBIT | P/E | P/NAV |
|---|---|---|---|---|---|
| Sun | 1.93 | 6.08 | 7.26 | 5.90 | 2.02 |
| Lux Island Resorts | 0.98 | 3.77 | 5.35 | 5.90 | 0.85 |
| Constance | 1.22 | 4.17 | 6.91 | 4.97 | 0.31 |
| Beau Vallon | 1.83 | 4.78 | 6.42 | 3.17 | 0.46 |
| 75th percentile | 1.86 | 5.10 | 6.99 | 5.90 | 1.14 |
| Median | 1.53 | 4.47 | 6.66 | 5.44 | 0.66 |
| 25th percentile | 1.16 | 4.07 | 6.15 | 4.52 | 0.42 |
| New Mauritius Hotels | 1.60 | 5.63 | 7.17 | 4.41 | 0.64 |
Look at the last two columns against the first three. Beachcomber is above the peer median on every enterprise multiple — 1.60 against 1.53, 5.63 against 4.47, 7.17 against 6.66. But on P/E it is 4.41 against a median of 5.44, and on P/NAV 0.64 against 0.66. On the equity measures it looks cheap.
Both readings are arithmetically correct, and the contradiction is the whole argument for using enterprise multiples. P/E is measured after interest, so a heavily borrowed company shows a small market cap sitting on top of the same profits and screens as a bargain. Enterprise value puts the debt back in. Beachcomber carries 3.05x net debt to EBITDA, the most in the set — which is exactly why it is the cheapest here on P/E and the dearest on EV/EBITDA.
Sources: Sun Limited FY June 2025; Lux Island Resorts FY June 2025; Constance Hotels Services FY December 2024; Beau Vallon Hospitality FY December 2024; New Mauritius Hotels FY June 2025 — all audited or abridged audited accounts, linked in full at the foot of this page. Share prices at 31 December 2025 from the SEM Factbook 2025, Official Market pp.24–25 and DEM p.35.
New Mauritius Hotels trades above the 75th percentile of its listed peers on the primary multiple, and above the median on all three. Applying the peer medians back to its own figures gives a spread of implied values:
The answer, in one paragraph
On this evidence, no — not at Rs 13.95. The market is already paying a premium to the listed peer group on every enterprise multiple, and the company carrying that premium is also the most indebted business in the set at 3.05x net debt to EBITDA. You are paying above the peer range for the balance sheet least able to absorb a bad year.
The case for the other side
A premium is not automatically wrong, and three arguments are available to defend this one:
- Scale and brand. NMH is roughly twice the revenue of the next-largest peer, and Beachcomber is the strongest hotel brand originating in Mauritius.
- The debt is buying something. Morocco and Zanzibar are funded expansion, not distress borrowing, and the Marrakech structure is designed to sell 51% of an SPV and repatriate capital.
- The peer set is four companies. A median on n = 4 is indicative. Two of the four have quirks of their own — Constance is a debt-funded holding structure, Beau Vallon faces 56% dilution from its convertible.
What a comp set actually settles. Not whether to buy. It sizes the premium precisely — 5.63x against 4.47x, Rs 13.95 against Rs 11.79 — so the argument stops being about whether the stock is expensive and starts being about whether scale, brand and an expansion pipeline are worth 26% more than the peer group. That is a question about the business. The spreadsheet just makes sure you are asking it about the right number.
The working file
FinallyWhat I got wrong
I kept a log of every mistake. Fifteen entries. Every single one was a which-line error, never an arithmetic one — the maths was fine, the wrong number went into it.
| What I did | What was actually true |
|---|---|
| Divided profit by share count and got an EPS of 0.00881 | The profit is in thousands; the share count is a literal count. Only one side was scaled. |
| Read the balance sheet down to “total liabilities” and stopped | The equity block above it holds the convertible bond, the minority answer and the NAV. |
| Backed out a share count from group profit | Earnings per share uses the owners’ profit. My count was 7% too high. |
| Took the cash figure off the cash flow statement | It was net of overdrafts that were already inside the debt figure — counted twice. |
| Read diluted EPS as something that had happened | It is a hypothetical. No shares had been issued. |
| Expected a 51% parent to report 51% of its subsidiary | Control means you consolidate at 100% and hand the rest back on one line at the bottom. |
The last one is worth dwelling on, because it is the same lesson as the whole post. Diluted earnings per share is not a record of an event. It is the accounts telling you what would be true under a different assumption — printed right next to a number that describes what is.
Financial statements are full of that. The job is not to read the numbers. It is to find the sentence that says which numbers you are reading.
If you want the rest of what I have built, it is on the work page, and other write-ups go up in Writing.
If you take five things away
- Say the units out loud before dividing. Statements are in thousands; share counts are not.
- The equity block has three lines, not one. Take the owners’ subtotal, never the total.
- Gross debt pairs with gross cash. Mixing them double-counts the overdraft.
- Book value is not market value. A minority interest carried at book on a company trading at 0.31x book will wreck an enterprise value.
- Read the accounting policy note. That is where the company tells you which choice it made.